Latest Version: 0.5.7
What is mysqlmymonlite.sh ? [download zip]
mysqlmymonlite.sh is a MySQL optimization tool - a lite version of more extensive featured mysqlmymon.sh - a MySQL and system monitoring script written by George Liu (eva2000) for quick stats check for apache, nginx, litespeed web server and mysql stats for the following operating systems:
- CentOS WHM/Cpanel
- CentOS
- Debian 6.x systems
mysqlmymon.sh is the big brother script to mysqlmymonlite.sh which is much more feature extensive and used for my private paid consults - it produces alot more detailed info for stats analysis and server & MySQL optimization but alot of the info is not suited to sharing in public. So I stripped down mysqlmymon.sh to create mysqlmymonlite.sh with aim of providing as much stats output as possible without revealing any private server sensitive information.
Thus mysqlmymonlite.sh was born and is used mainly for vBulletin server optimisation requests on public forums providing nginx, apache, litespeed web server, openlitespeed web server, mysql, cpu, memory, disk usage stats and general overview of server status in order to understand a vB client's server environment and loads. All this info takes less than <12 seconds to gather once the script is run.
Changes of note:- mysqlmymonlite.sh 0.4.2 adds MySQL 5.5+ Performance Schema output support.
- mysqlmymonlite.sh 0.4.8 updated to support OpenLiteSpeed web server. Sample output stats.
- mysqlmymonlite.sh 0.5.2 add WEBONLY option
- mysqlmymonlite.sh 0.5.3 fix mysqltuner --forcemem prompt when root password set & update mysqltuner.pl to 1.4.0 modified version
- mysqlmymonlite.sh 0.5.4 update for defaults-extra-file support for mysql 5.6 & mysqltuner.pl 1.5.1 with MariaDB 10 and Aria Engine support
- mysqlmymonlite.sh 0.5.5 May 3, 2017: update mysqltuner.pl 1.7.1 & nginx.conf settings inspection/display
- mysqlmymonlite.sh 0.5.6 September 19, 2018: improve nginx.conf detection & fix WHM/cPanel compatibility
- mysqlmymonlite.sh 0.5.7 October 25, 2018: fix cpanel/WHM incorrect detection for Apache existence when LiteSpeed running
How to use mysqlmymonlite.sh ?
You'll need ssh telnet and root user access. Read the included zip file's readme.txt file carefully. From v0.4.0 onwards, there's 2 ways to configure your settings. Either by editing mysqlmymonlite.sh itself or the included config.ini to enter MySQL server's my.cnf location, root username and password details:
    MYCNF='/etc/my.cnf'
    USER='yourmysqlrootusername'
    PASS='yourmysqlrootpassword'
Upload mysqlmymonlite.sh (and if needed the optional config.ini) to server i.e. /root/mysqlmymonlite.sh (and /root/config.ini if needed)
Type the following in SSH2 telnet as root user:
    cd /root
    chmod +x mysqlmymonlite.sh
To run the script, use the run command below which will save stats to text file named mysqlmymonlite_stats.txt:
    cd /root
    ./mysqlmymonlite.sh run 2>/dev/null > mysqlmymonlite_stats.txt
How to install and use mysqlmymonlite.sh video - best viewed in full screen HD mode.
Modified mysqltuner.pl
For folks more use to mysqltuner.pl output for MySQL optimizations, the script includes a slightly modified version of mysqltuner.pl which you can call via the command option below. You can see example output for mysqltuner.pl here
./mysqlmymonlite.sh mysqltuner
Extend mysqlmymonlite.sh with custom command
v0.3.8 added the ability to customise and extend mysqlmymonlite.sh with end user custom SSH telnet command line support. A new menu option called 'custom' which can be called via ./mysqlmymonlite.sh custom. This option allows you to create a separate includes file name it incopt.inc and place it in same directory mysqlmymonlite.sh is located in. You can add your own custom SSH bash shell commands to this incopt.inc file to further extend mysqlmymonlite.sh's functionality and usefulness. Invoke and run these custom commands via:
./mysqlmymonlite.sh custom
For instance you could add iostats, php-fpm status and memcached stats commands to incopt.inc file as follows:
    echo ""
    echo "iostat -x 5 2"
    iostat -x 5 2

    echo ""
    echo "lynx --dump  http://127.0.0.1/phpstatus"
    lynx --dump  http://127.0.0.1/phpstatus

    echo ""
    echo "memcached-tool 127.0.0.1:11211 stats"
    memcached-tool 127.0.0.1:11211 stats
Full details are explained in readme.txt file included in download zip file. If you're familiar with bash shell scripting and normal SSH telnet environment commands, you can get pretty creative with what you add to incopt.inc file.
Setup mysqlmymonlite.sh scheduled cron jobs
The download zip file has a readme.txt file which has more detailed explanations and example usage commands - including how to setup a scheduled cron job to save output stats to timestamped text file or email the stats to a specified email address at specified intervals i.e. every 1 hour etc.
Sharing stats publicly
Sole purpose for mysqlmymonlite.sh is to allow server owners to quickly gather stats for their own use or to provide these stats publicly on forums etc, so that other users and readers can use these stats to provide server recommendations, optimisation advice or troubleshooting advice. If you're using forums as medium for sharing these stats, it's best to use the forum's custom BBCODE tags for code format [CODE][/CODE] to wrap the output stats for easier reading.
Notes & Tips:
- If your SSH2 Telnet client options allow for it you can increase the size of your scroll back buffer size to allow larger amounts of outputted text to be shown via scrolling back and forth.
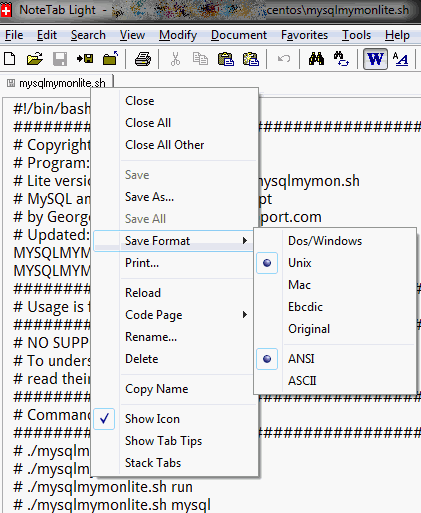
- If you get the following error: mysqlmymonlite.sh: /bin/bash^M: bad interpreter: No such file or directory, you probably edited the mysqlmymonlite.sh file on windows and added additional non-unix characters. You can convert the file to unix format via ssh telnet using command run from directory where mysqlmymonlite.sh is located:
dos2unix mysqlmymonlite.sh - Or use a text editor which can save the file in unix format. I use NoteTab Lite, open file and right click on the title tab for the filename and select 'save format' -> unix. Then continue editing file and saving it.
Download mysqlmymonlite.sh:
mysqlmymonlite.sh currently is only available for download from the following locations listed below.
Please be careful downloading the script from locations or web sites other than the below listed sites:
- mysqlmymon.com
- cpanel.net Optimization forums direct link here
Download link: mysqlmymonlite.zip (Latest Version: 0.5.7)
Menu options:
- As you can see below, besides the main run option which grabs all the stats, there's a few other options you can explore for vmstat and standalone mysqltuner, mysqlreport.
- The showcreate, showindex, vbshowtables options are for MySQL where you can enter a MySQL database name and output to screen or save to text files the database's tables' show create, show index structure and database's table names. Handy when you don't even want to bother loading phpmyadmin or need to compare a database's table creation and index structure - i.e. output to text file 2 databases' index structure and then use a file DIFF compare tool to compare their indexes on each table.
- The dblist option just spits out a list of all MySQL databases on your server.
Example output
All sensitive server hostname info has been masked and rewritten to just show the words 'yourhostname' instead of your real hostname making it anonymous. But please double check your output stats before posting online on forums or in public. For instance if you actually set your mysql password in /etc/my.cnf, the output will show that password, so remove it from output before posting publicly.
Below are example output stats gathered by mysqlmymonlite.sh:
| mysqlmymonlite.sh command options |
|
|---|---|
| Basic Summary Stats |
|
| CPU Top Stats (mpstat & top ) |
|
| Memory Stats (free & psmem.py & meminfo) |
|
| Disk Space Usage Stats (df) |
|
| Web Server & PHP Info |
|
| Apache Info (fullstatus / mod_status) |
|
| MySQL Report Stats (explained) |
|
| MySQL Storage Engine Tables Size (explained) |
|
| MySQL Server Variables Output (excerpt) (5.1 variables & 5.5 variables) |
|
| MySQL Server Extended Status Output (excerpt) (5.5 status & 5.1 status) |
|
| InnoDB Table Status Output (5.1 status & 5.5 status) |
|
| MySQL Error Log (5.1 error log & 5.5 error log) |
|
| Nginx server configuration |
|
| Litespeed web server stats (4 cpu license) |
|
| mysqltuner option (modified version) |
|